Monitoring the DNS stack
After the HA DNS build, the setup worked but I could only tell it worked by checking it manually. This phase added monitoring, which is what turned it from something I configured into something I operate.
The stack is the standard one: Prometheus for metrics, Grafana for dashboards, Blackbox Exporter for probing endpoints, Node Exporter for host metrics, and Alertmanager routing alerts to Discord.
Standing it up
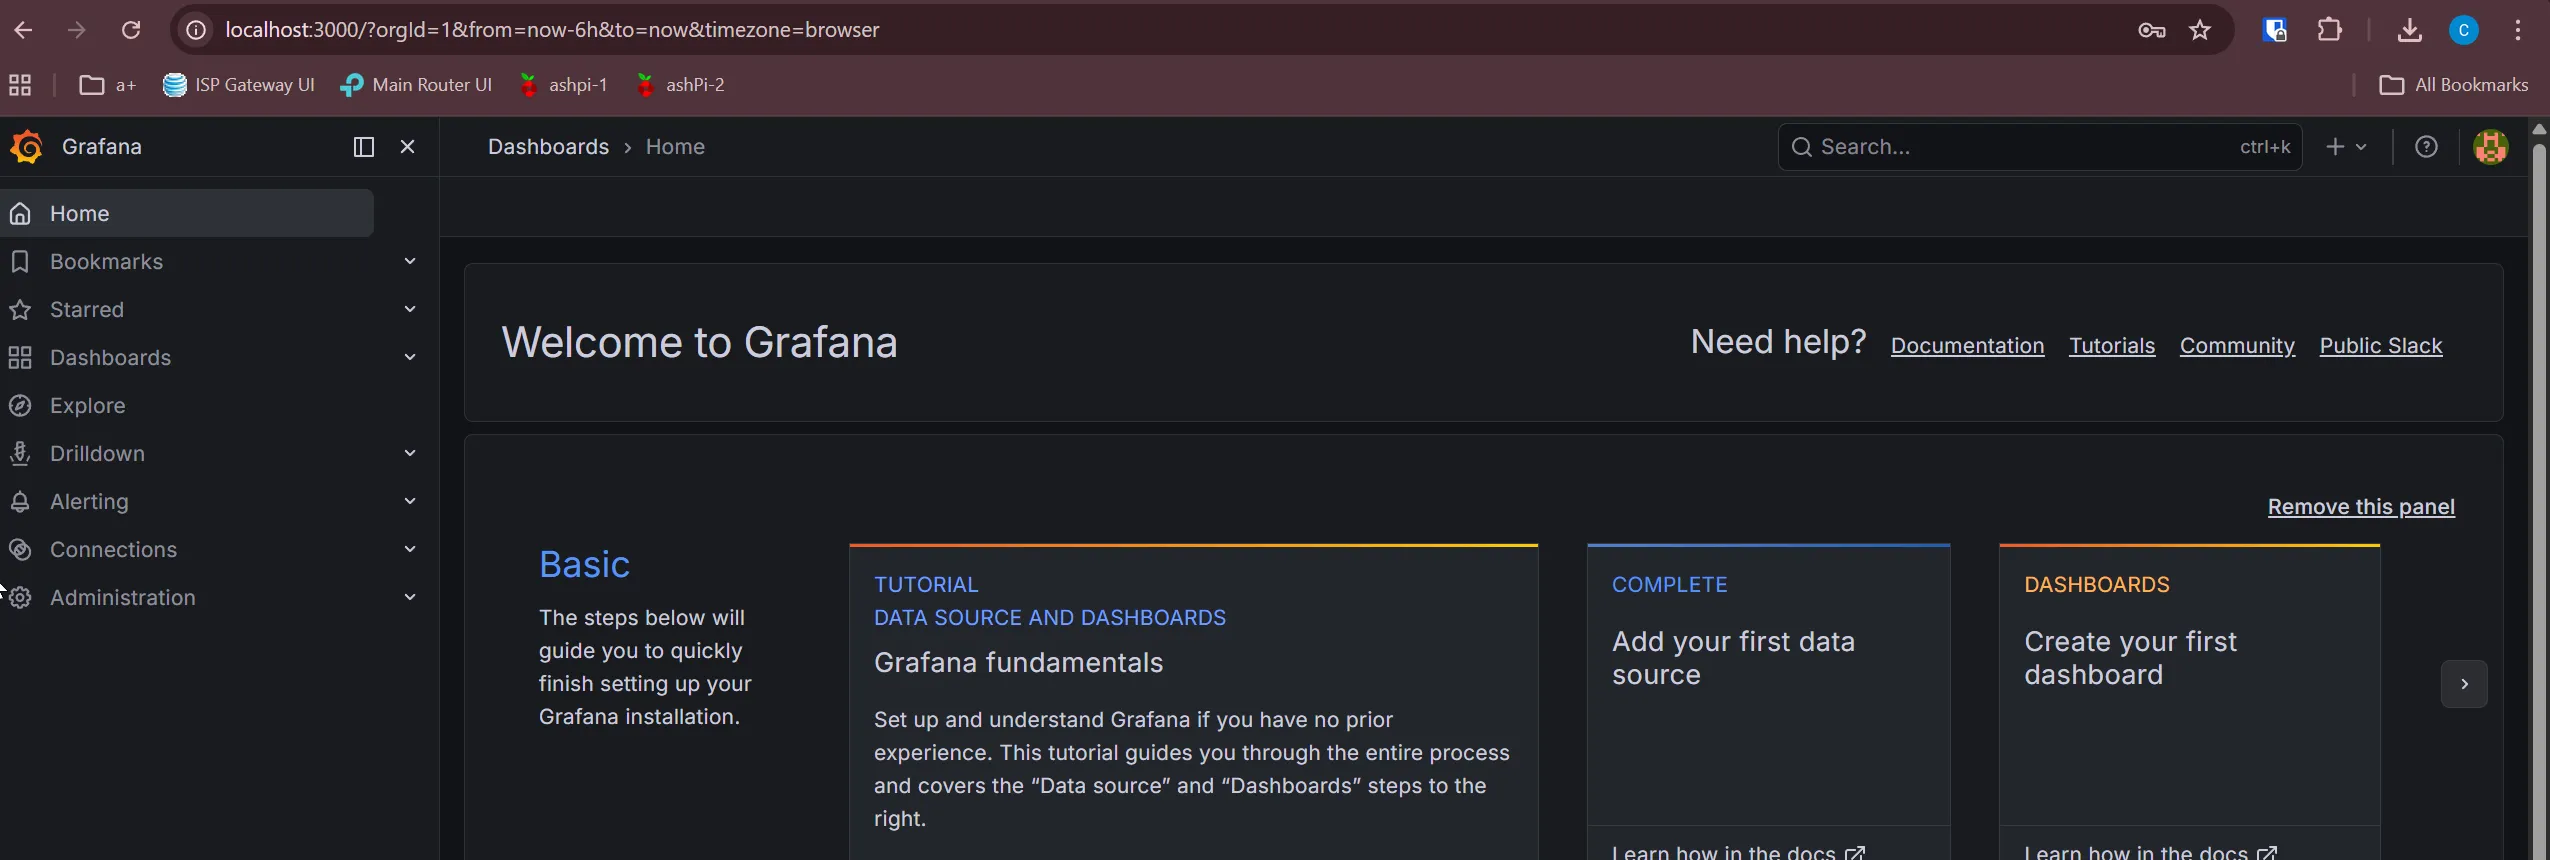
Grafana on a fresh install, before any dashboards or data sources.
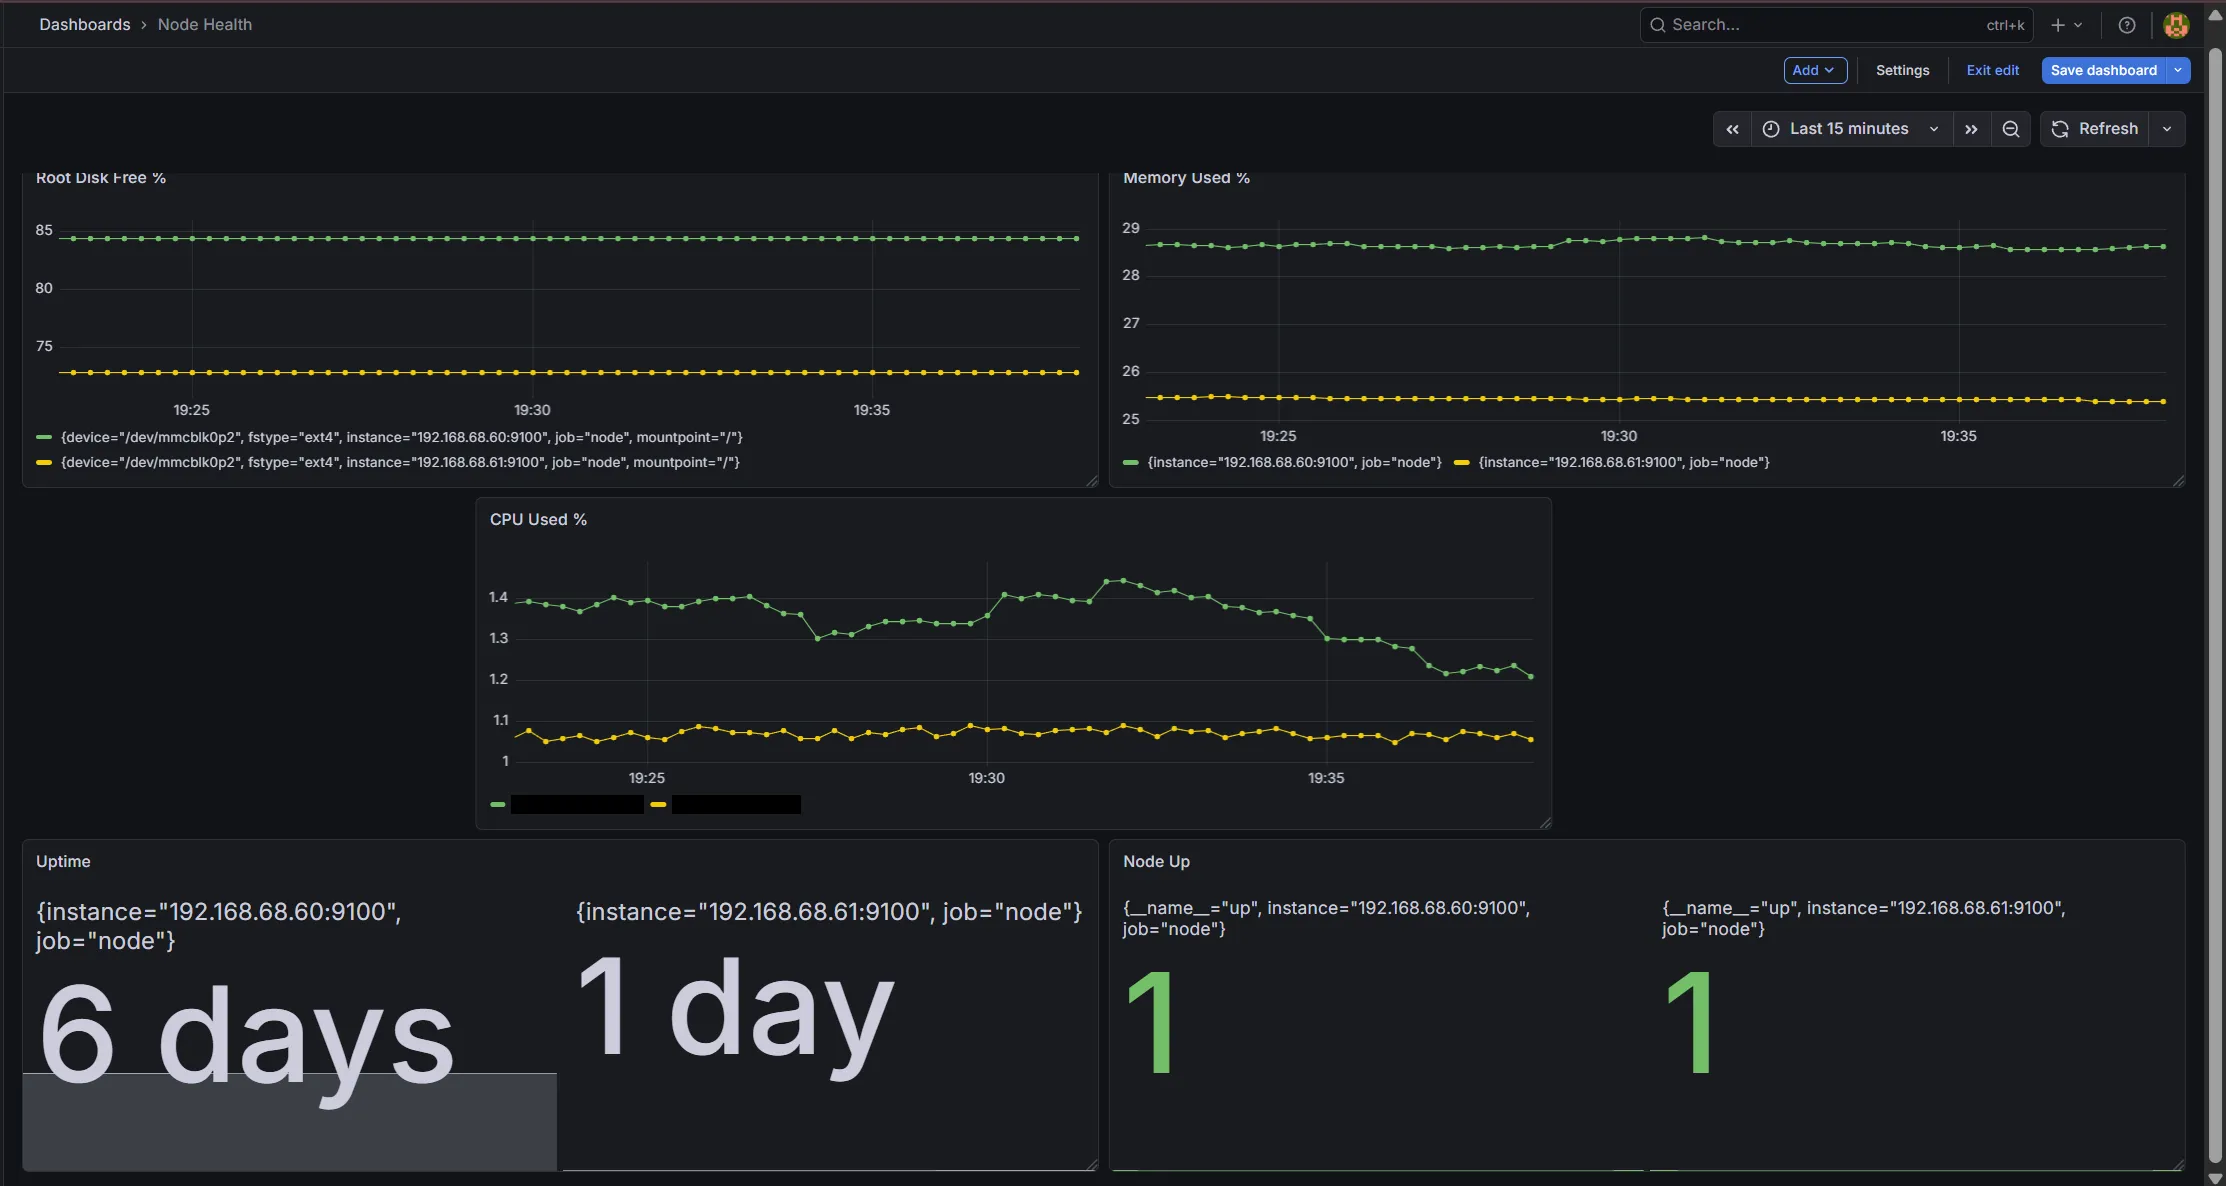
Node Exporter on both Pi-hole nodes gives host-level metrics: disk, memory, CPU, uptime, and a simple up/down signal.
The more useful probes are the Blackbox ones that check DNS itself: resolution against each node directly, and against the Keepalived VIP that clients actually use. A green host with a wedged resolver still shows as a DNS failure that way.
Testing the alerts
A dashboard shows state. An alert is a claim that something will happen when state goes bad, and that claim is worth nothing until you’ve seen it fire.
So I broke a node on purpose. Stopping Node Exporter on ashpi-2 produces a
SingleNodeDown alert: pending first, then firing, then a Discord
message.
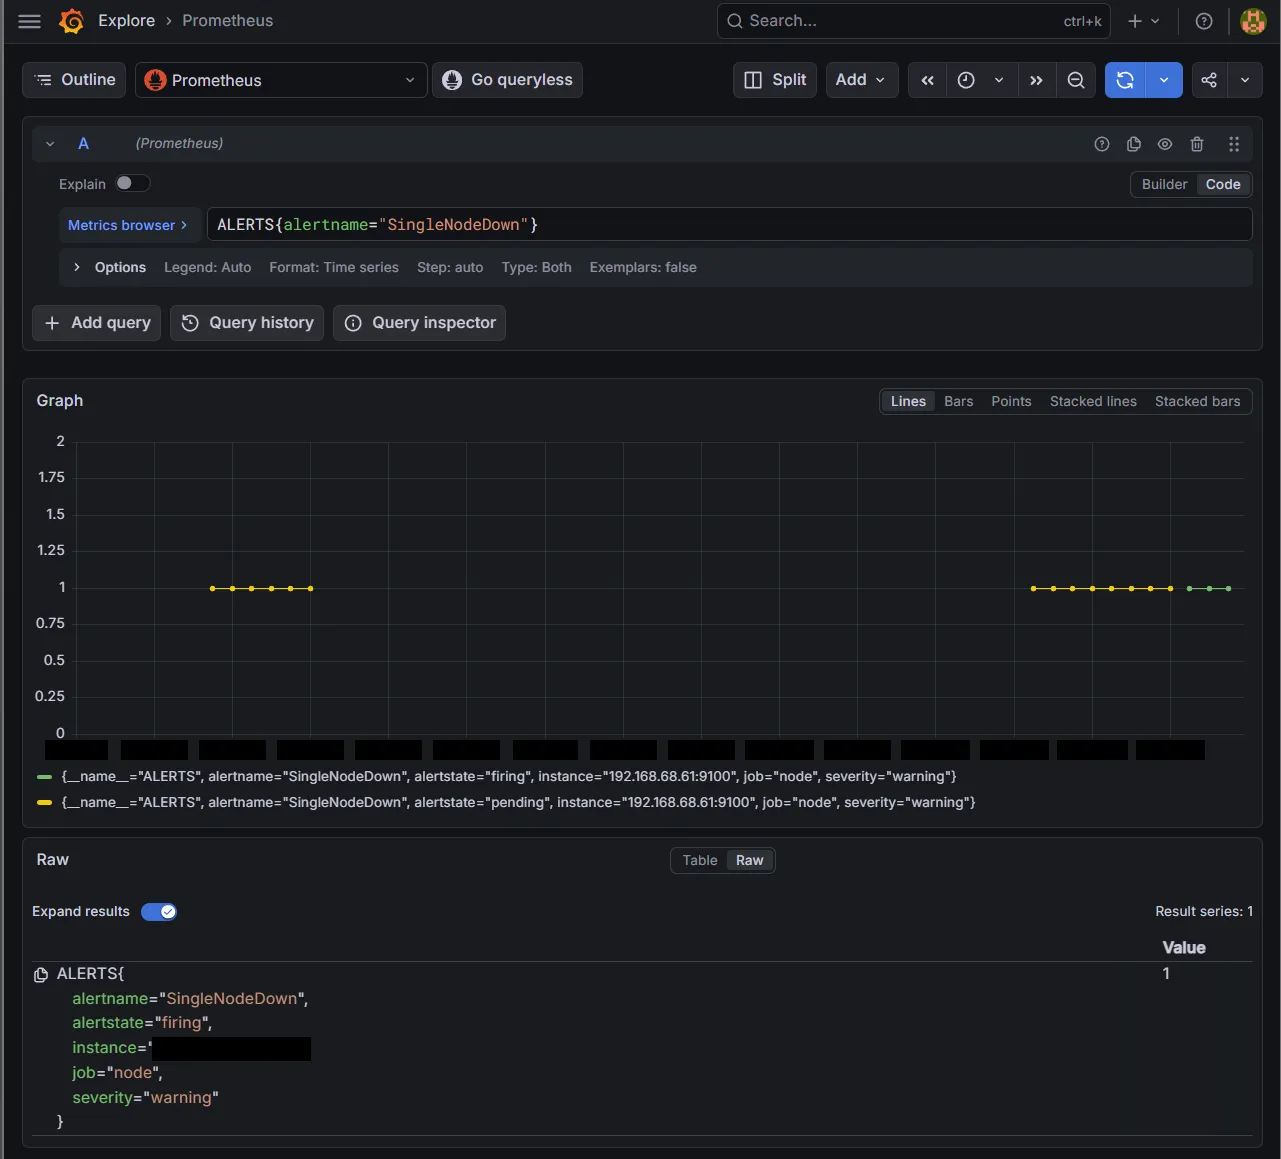
Bringing the node back clears it, and Alertmanager sends the recovery notification.
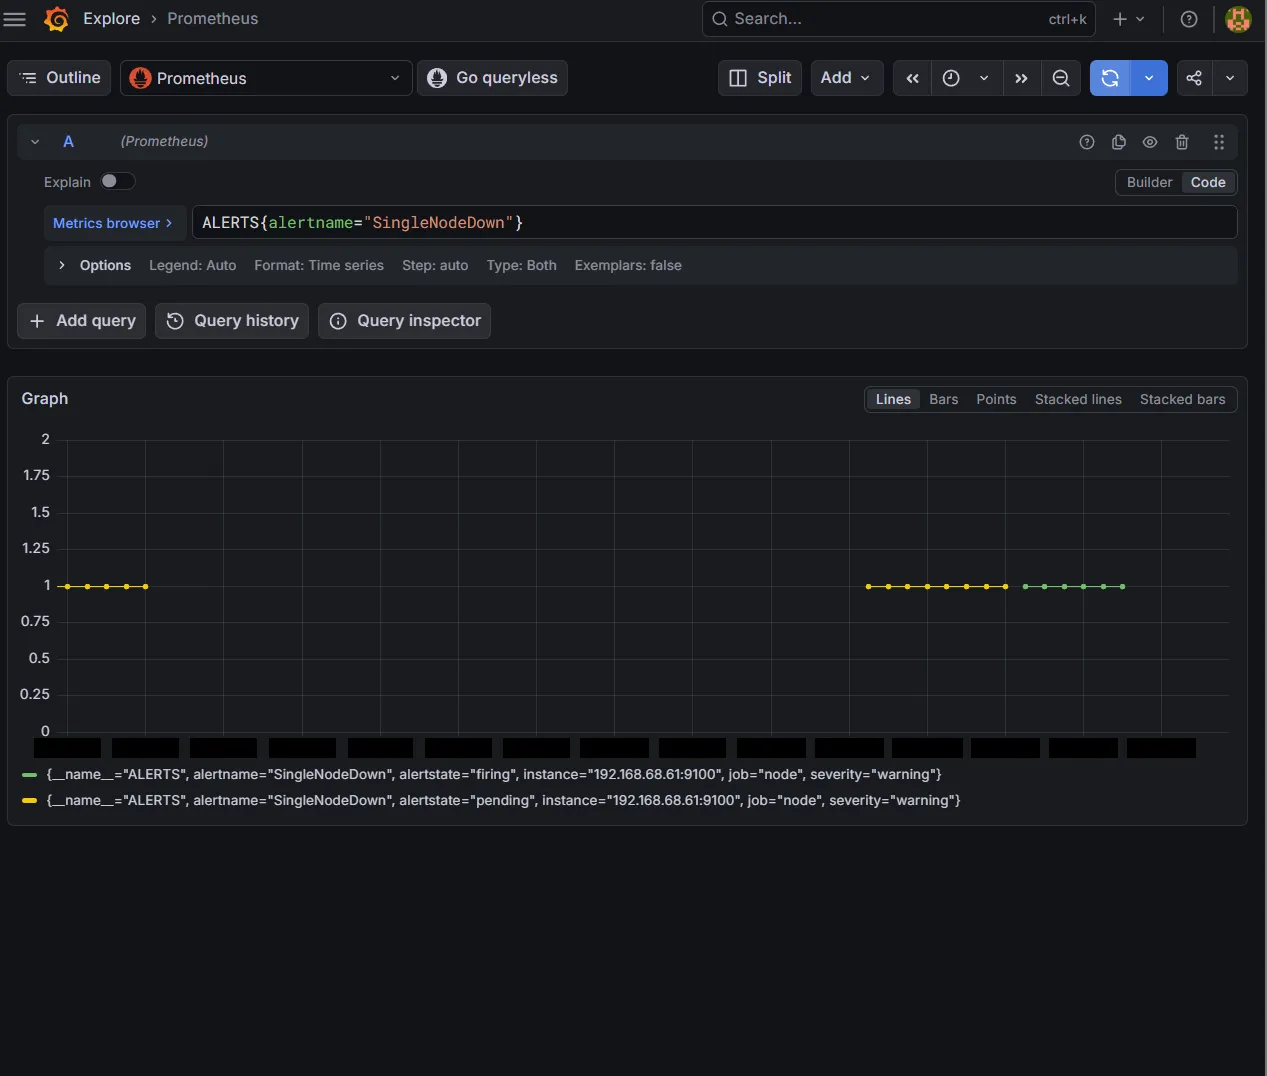
I did the same for the failover case: force the VIP to move, confirm the per-node and VIP probes track it, confirm the dashboards reflect it, and confirm the alert state is what I expected throughout.
What monitoring changed
Before this phase, “is DNS healthy” was a question I answered by SSHing in and running commands. After it:
- the state is visible at a glance
- a real failure produces a notification I’ll actually see
- I’ve watched the alerts fire and recover, so I trust them
- the failover path is monitored end to end, not just the two boxes
That’s the difference between a configured service and an operated one. The next phase made the whole thing reachable from outside the house without opening any ports.